 English
 Українська
 Русский
ASSRs are especially useful for objective hearing threshold determination at low frequencies, where DPOAEs are not available. For objective determination of hearing thresholds it is recommended to measure at a first stage DPOAE Threshold at the required frequencies and to measure at a second stage ASSRs at frequencies where no DPOAE response could be detected. Average test time for eight test frequencies is about 15 minutes for normal hearing subjects and for hearing impaired subjects about 25 minutes (Rosner, 2013b).
Two ASSR workflows are available:
– ASSR Fixed allows frequency-specific measurement of ASSR at one or multiple levels. A response detection status (valid/invalid response) is delivered for each frequency/level combination.
– ASSR Threshold allows frequency-specific determination of hearing thresholds within a configurable level range by measurement of ASSR with adaptive level setting (bracketing algorithm). Hearing loss is estimated by means of fixed offset values. Threshold detection is stopped at a frequency if two consecutive responses at a frequency are not valid.
ASSR tests can be performed binaurally if an adequate transducer is connected (e.g. headphone, two ear probes), which may reduce test time by a factor of two. ASSR can be measured at frequencies from 250 Hz to 8 kHz with multi-frequency stimulus presentation.
PRACTICAL USE
Select ASSR from the module selection screen. If more than one AEP test is licensed, ASSR can be found in the AEP section. Select the preset that you would like to perform. If necessary, change the parameters (e.g. test mode, stimulus frequencies, stimulus levels (ASSR Fixed) or level range (ASSR Threshold), stimulus rate, stimulus bandwidth, averaging time) and the preset name as required.
Stimulus rate:
It is generally recommended to use 40 Hz ASSR in awake and alert subjects (e.g. children and adults) and to use 80 Hz ASSR in sleeping subjects (e.g. babies, sedated subjects, during anesthesia). The auto mode provides a performance-optimized stimulus rate paradigm that increases the stimulus rate with increasing frequency taking into account the dependency of stimulus rates on carrier frequencies and the dependency of noise floor levels on stimulus rates. The auto mode can be used for awake or sleeping subjects. Please note that stimulus rates are jittered for improving resistance to interfering noise.
Stimulus bandwidth:
With increasing stimulus bandwidth the response amplitude increases but frequency specificity decreases. The stimulus bandwidth selection impacts the frequency selection.
Masking noise
Contralateral masking is recommended if there is significant asymmetry in hearing loss between ears, i.e. differences of about 30 to 40 dB (headphones) or about 50 to 60 dB (insert earphones). If a bone conductor is used, application of contralateral noise is essential.
Averages:
At fixed measurement conditions, with increasing averaging time, the noise floor decreases and the reliability of the validity of responses and hence the quality of threshold determination increases. Page 108 / 140
Noise stop criterion:
If activated (i.e. noise stop criterion >0 nV), the recording of a trace is stopped as soon as the residual noise drops below the defined noise threshold and no response is detected. Hence, if activated this option speeds up the recording in case no response is present.
Before the test is started the subject should be instructed about the test procedure. In order to reduce muscle artefacts, the subject should be calm and fully relaxed lying comfortably on a recliner or bed. For 40 Hz ASSR subjects should stay awake, whereas for 80 Hz ASSR subjects may sleep. For babies, try to test the subject during spontaneous sleep or sedation if medically approved. In order to reduce environmental artefacts, conduct the measurement in a room with low electromagnetic radiation, i.e. in an electrically shielded metal booth or any other room without powered-on electric devices (e.g. computer, light, telephone, cell phone, power transformer) in close range to the measurement equipment. A shielded electrode cable may also help in reducing electromagnetic noise. An acoustically shielded booth or a quiet room is recommended if ASSR is applied for threshold determination at low sound pressure levels.
Make sure that a valid transducer (e.g. headphone, insert earphone, ear probe, bone conductor) and electrode cable are connected. Make sure that the skin is clean at the intended positions of the electrodes.
Select the test ear (Right+Left: simultaneous measurement of right and left ear – please note that in this case a symmetric electrode montage is recommended). The electrode impedance measurement starts. Both impedances must be <12 kΩ in order to be able to proceed with the measurement. It is recommended that impedances are <6 kΩ and that the difference between red and white electrode impedance is <3 kΩ. After successful electrode impedance measurement, you can start the test by pressing the play button. The ASSR stimuli are presented via the transducer and the response is detected via the electrode cable. During the measurement the electrode impedance is monitored. In case that at least one of the impedances gets too high (e.g. an electrode has fallen off), the test is automatically interrupted. The test can only be continued if the electrode impedances get back to tolerable values.
The statistical validity of an ASSR is shown for each currently tested frequency/level combination ①. The traces are shown in red (right ear) and/or blue (left ear). For 40-Hz ASSR up to two and for 80-Hz ASSR and for automatic stimulus rate mode up to four frequency/level combinations are measured simultaneously. A trace is finished if it hits the top of the box (valid response), if it hits the gray triangular area within the box (invalid response) or if the configured maximum averaging time is reached (invalid response). The EEG noise bar ② represents biological and external noise which is an indicator for the adequacy of measurement conditions. With good measurement conditions, the EEG noise bar should remain green. With increasing noise, the EEG noise bar gradually turns yellow and red, which indicates that biological and external artefacts may be too high, i.e. the patient may be not calm and relaxed enough (e.g. swallowing, moving, clenched jaw/teeth), or the electromagnetic radiation may be too prominent. When pressing the EEG noise bar, an EEG noise graph ⑤ is shown. You can return to the EEG noise bar view by pressing the EEG noise graph. The overall progress bar Page 109 / 140 ③ shows the progress of the measurement. If the bar is full, the complete test sequence is finished. The electrode impedance ④ is regularly updated during the measurement and the measurement is paused if impedance gets too high.
The test can be manually paused ⑦, continued after a pause (pause button turns to play button – not shown in Figure 60), or stopped ⑥. Also, a current measurement can be skipped ⑧. If multiple measurements are running the frequency/level combination can be selected (skip ⑨: skip level at frequency, stop ⑩: skip all levels at frequency) after pressing the main forward button ⑧. The forward ⑨ and stop buttons ⑩ at the frequency/level combinations can be removed by pressing the main forward button ⑧ again. The current measurement status for the right or left ear can be displayed when pressing the left or right graph area, respectively. The screen is colored red for the right ear and blue for the left ear. Currently tested frequency/level combinations are shown with the clock symbol ⑪, already tested frequency/level combinations feature a green check mark ⑫ (valid response), a red Ø ⑬ (invalid response), or a gray Ø (incomplete response because measurement was stopped for this frequency/level combination).
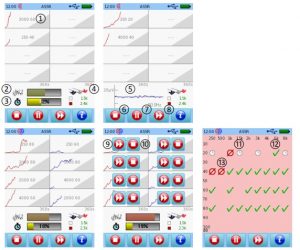
Figure 1: ASSR measurement (top: monaural 40 Hz ASSR measurement; top left: standard measurement screen; top right: measurement screen with EEG noise graph; bottom: binaural 80 Hz ASSR measurement; bottom left: standard measurement screen; bottom middle: skip/stop selection; bottom right: measurement status and result matrix)
After the test is finished, the ASSR result is shown (see Figure 61 for general ASSR result views and Figure 62 for audiogram result view specific for ASSR Threshold). For all ASSR measurements, three screens are available. The response status matrix ① shows the response status for each tested frequency/level combination, i.e. if the response is valid (green check mark), invalid (red Ø) or undefined/not finished (gray Ø). When pressing any of the response status symbols, the related detailed response information ② is shown including information on frequency, level, stimulus rate and response status at the top of the screen. Below, the statistical validity trace is shown in red (right
ear) or blue (left ear), respectively. In Figure 61 you can see three typical response examples (bottom left: valid response – the validity trace hits the top of the box before the maximum measurement time is reached; bottom middle: invalid response – the validity trace hits the gray triangle within the box; bottom right: invalid response – the timeout is reached without getting a valid response). At the bottom, the response amplitude, noise amplitude, and electrode impedances are displayed. You can return to the response status matrix by pressing the screen or the back button. The general information screen ③ shows the applied transducer, the test configuration (test mode, stimulus bandwidth, stimulus rate), and the total measurement time.
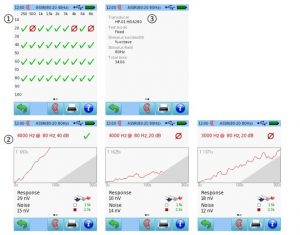
Figure 2: ASSR result (top left: response status matrix; top right: general test information; bottom: detailed response information for valid and invalid responses)
In order to ensure adequate measurement conditions noise should be below 20 nV after 360 s averaging time. With increasing averaging time, noise decreases and vice versa, i.e. if a valid ASSR response is detected quickly, a higher noise is expected to be shown.
For ASSR Threshold an additional ASSR audiogram is available. The audiogram shows estimated ASSR thresholds, which are derived by subtracting an empirically determined offset from the lowest stimulus level at which a valid ASSR response has been detected (Rosner, 2013a).
Thresholds are shown in red (right ear) or blue color (left ear). The width of the threshold symbol corresponds to the configured stimulus bandwidth. An arrow up symbol at the threshold symbol means that the threshold is equal or better to the shown threshold. An arrow down symbol means that the threshold exceeds the level at which this symbol is shown. By sliding a finger from right to left on the audiogram screen, the response matrix is shown.
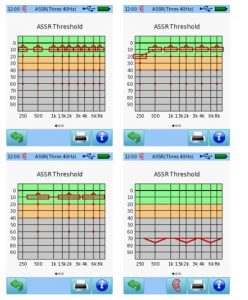
Figure 3: ASSR Threshold result (top left: ½ octave stimulus bandwidth; top right: octave stimulus bandwidth; bottom: two octaves stimulus bandwidth). The following case examples show that ASSRs are capable of appropriately estimating behavioral thresholds. The relationship between hearing thresholds estimated from ASSR
measurements and behavioral hearing threshold has been investigated by various study groups.
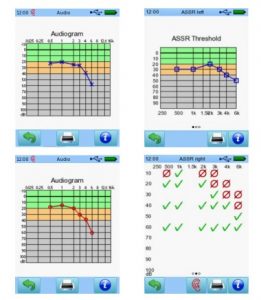
Figure 4: ASSR case examples (left top/bottom: behavioral pure-tone thresholds; right top: ASSR thresholds; right bottom: ASSR response status matrix)