 English
 Українська
 Русский
Distortion product otoacoustic emissions (DPOAEs) represent cubic distortions of outer hair cells (OHC) when stimulated simultaneously by two tones f1 (lower frequency) and f2 (higher frequency) (see Figure 28). DPOAEs arise directly from the frequency-selective compressive nonlinearity of OHCs.
The two primary tones interact in the cochlea within the region of overlap of the traveling waves of the two primary tones close to the characteristic place of f2. Thus, DPOAEs can be applied for frequency-specific assessment of cochlear dysfunction at the f2 place. In humans, both quadratic (e.g. f2-f1) and cubic distortion products (e.g. 2f1-f2) can be detected.
The cubic distortion component 2f1-f2 yields the highest amplitude and is therefore primarily used in audiological diagnostics.
DPOAE amplitudes typically range from about 20 dB SPL down to the limiting noise floor level, i.e. about -20 dB SPL. DPOAEs provide quantitative and frequency-specific information about the range and operational characteristics of the cochlear amplifier, i.e. sensitivity, compression, and frequency selectivity of the hearing organ.
The number of OHCs contributing to DPOAE generation depends on the size of the overlapping region, which is determined by the primary tone levels L1 and L2, and the frequency ratio f2/f1. A frequency ratio of about 1.2 was found to be optimal. Different primary tone level ratios have been suggested. A primary tone level setting, which accounts for the different compression of the primary tone traveling waves at the f2 place, is the scissor paradigm
Due to the steep slope of the traveling wave towards the cochlear apex, the maximum interaction site is close to the f2 place in the cochlea. To preserve optimum overlap of the primary tone traveling waves at a constant frequency ratio, the primary tone level difference has to be increased with decreasing stimulus level. This results in a decrease in L1 being lower than the decrease in L2.
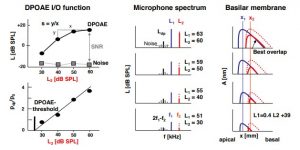
Figure 1: Schematic overview of DPOAE generation with different primary tone level settings: scissor paradigm (solid lines), L1 = L2 (dotted lines).
There are several objective methods for separating the DPOAE signal from the background noise and for automatically evaluating the validity of a recorded emission. The first method is based on the calculation of the noise floor level by averaging the levels of several adjoining frequency components around the DPOAE frequency component, with the SNR being indicated by the difference between the emission level and the noise floor level. The SNR criterion is usually set to 6 dB. The second data validation procedure is based on phase statistics, which checks the coupling of the DPOAE component phase to the phase of the primary tones. The phase statistics average normalized phase vectors of the signal received at the known DPOAE frequency. Like the binomial statistics, the vector sum can be scaled in probability terms, providing defined and very high sensitivities. A typical level of significance exceeds 99 % per single frequency test.
DPOAE grams plot the DPOAE level Ldp as a function of f2 (the main DPOAE generation site) for a selected combination of primary-tone levels L1 and L2. It should be emphasized that DPOAE grams reflect the sensitivity of the cochlear amplifier (CA) best when recorded at close-to-threshold stimulus levels.
DPOAE level I/O-functions plot the DPOAE level Ldp as a function of primary-tone level L2 for a selected f2 and thus reflect CA dynamics at the f2 place in the cochlea (Dorn et al., 2001). In normal hearing, in response to low-level stimuli, DPOAE level I/O-functions exhibit steep slopes, while at high stimulus levels slopes decrease, thus mirroring the strong amplification at low and decreasing amplification (saturation) at moderate sound levels. However, this is only true when a specific stimulus level setting is used which accounts for the different compression of the primary-ones at the f2 place.
DPOAE pressure I/O-functions plot the DPOAE pressure pdp (instead of the DPOAE level Ldp) as a function of the primary-tone level L2. Due to the logarithmic dependency of the DPOAE level on the primary tone level there is a linear dependency between DPOAE pressure pdp and primary tone level L2.
The intersection point of the linear regression line with the L2-axis at pdp = 0 Pa can then serve as an estimate of the stimulus level at the DPOAE threshold.
The estimated threshold level Ldpth when plotted across frequency f2 provides a measure for estimating CA threshold at the f2 place. Due to standing waves in the outer ear canal, stimulus and response cannot always be reliably determined and thus DPOAE thresholds do not always match pure-tone thresholds. This is true especially for large ear canal volumes. If this is the case a discrepancy between DPOAE thresholds and PTA thresholds mainly occurs for adults (dependent on ear canal size) in the mid-frequency region around 3 kHz and at the higher test frequencies (> 6 kHz). Standing wave effects are less important in newborns and infants due to the shorter ear canal length.
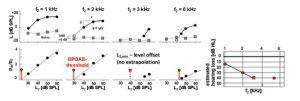
Figure 2: Schematic overview of a DPOAE audiogram derived from DPOAE threshold estimation
Two DPOAE workflows are available:
– DPOAE Quick/Diagnostic allows for a frequency-specific measurement of DPOAEs at one or multiple stimulus levels. A response detection status (valid/invalid response) is delivered for each selected frequency/stimulus level combination. DPOAE Quick refers to a measurement at one screening level, whereas DPOAE Diagnostic refers to a measurement at multiple levels. User-definable criteria can be set, i.e. SNR criteria (6, 9 or 12 dB) and for DPOAE Quick an overall pass criterion (number of valid responses: x out y).
– DPOAE Threshold allows for a frequency-specific determination of cochlear hearing thresholds by measuring DPOAEs with adaptive level setting. Estimating cochlear hearing loss by means of extrapolated DPOAE I/O-functions provides a quantitative assessment of outer hair cell function/dysfunction. An automatic frequency and level optimization procedure is conducted before each measurement at a specific frequency.