 English
 Українська
 Русский
DPOAE Threshold threshold estimation with automatically controlled stimulus levels.
DPOAE Threshold allows for a frequency-specific determination of cochlear hearing thresholds by measuring DPOAEs with adaptive level setting. Estimating cochlear hearing loss by means of extrapolated DPOAE I/O-functions provides a quantitative assessment of outer hair cell function/dysfunction. An automatic frequency and level optimization procedure is conducted before each measurement at a specific frequency.
PRACTICAL USE
Select the DPOAE test that you would like to perform from the module selection screen, i.e. DPOAE Quick, DPOAE Diagnostic or DPOAE Threshold. If more than one OAE test is licensed, DPOAE Quick, DPOAE Diagnostic, and DPOAE Threshold can be found in the OAE section. Select the preset that you would like to perform. If necessary, change the parameters (e.g. f2 frequency; for DPOAE Quick/Diagnostic: L2 level, SNR criterion; for DPOAE Quick: overall pass criterion; for DPOAE Diagnostic: L2/L1 setup, minimum Ldp, timeout) and the preset name as required. For L2/L1 level setup, PATH MEDICAL recommends to use the Auto setting which provides optimized primary tone levels similar to the scissor paradigm by Kummer et al. (2000). You can either select adaptive timeout (timing is controlled by the device) or manual timeout with a minimum and maximum measurement time. Please consider that a doubling of measurement time corresponds to an increase in SNR of up to 3 dB. If licensed, FMDPOAE and Multichannel DPOAE mode may be activated in order to improve DPOAE reliability and measurement time, respectively. For DPOAE Diagnostic, the DPOAE High Resolution option can be used with linear or logarithmic step size for measuring DPOAE grams in a user-definable frequency range or for measuring DPOAE fine structure. If fine structure properties are meant to be investigated, FMDPOAE should be deactivated. In all other cases, it is recommended to activate FMDPOAE.
The subject should be calm and sitting comfortably in a chair or lying on a bed. For babies, try to test the subject during sleep. Make sure that a valid ear probe (e.g. EP-DP, EP-VIP) is connected and that the cable of the ear probe does not rub against any material as e.g. clothes. Select an ear tip with appropriate size matching the probe tip size and the subject’s ear canal size. Make sure that the ear Page 75 / 140 probe is inserted without any leakage between ear probe and ear canal. In cases where the ear probe is not inserted properly or ear probe channels are blocked a warning will appear.
Select the test ear (Right+Left: simultaneous measurement of right and left ear). After successful ear probe calibration (see Figure 30), the measurement starts. For further information on ear probe calibration please refer to section. The ear probe calibration view mode can be configured in DPOAE Preferences. The DPOAE stimuli are
presented according to the parameter settings and the response is detected via the ear probe microphone. During the DPOAE Quick/Diagnostic measurement, the following screen items are displayed:
DPOAE Threshold (see Figure 1):
– DPOAE validity ① and timeout bar ② for currently tested f2/L2 combinations
– Noise bar ③
– Test status level-frequency-matrix ⑪: filled vertical bars indicate at which minimum level a valid DPOAE was detected, open box symbols indicate at which f2/L2 a DPOAE measurement is currently running
– DPOAE audiogram ⑫ (displayed for right or left ear when pressing the screen on the lower or upper screen side, respectively).
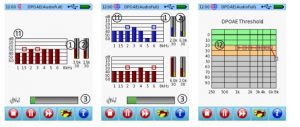
Figure 1: DPOAE Threshold measurement (left: monaural; middle: binaural; right: audiogram)
DPOAE Threshold (see Figure 41):
– DPOAE audiogram, i.e. estimated DPOAE thresholds Ldpth plotted across f2. The type of DPOAE threshold estimation is indicated by means of different symbols. Estimated thresholds are limited to 50 dB HL. If one or two valid points are available, thresholds are estimated by subtracting an experimental offset. If more than two valid points are available, thresholds are estimated by means of linear regression analysis (see Figure 34). When pressing the result screen, also the valid DPOAE f2/L2 combinations are shown in the audiogram graph as red (right ear) or blue (left ear) dots.
– DPOAE gram: plots DPOAE levels for all f2 at all L2 (different color for each L2). The DPOAE gram can be run through all L2 by pressing the result screen. For a single L2, the DPOAE and noise levels for all f2 at the selected L2 are plotted.
– DPOAE I/O function: plots DPOAE levels for all L2 at a selected f2. The DPOAE I/O function can be run through all f2 by pressing the result screen.
– DPOAE threshold table (including DPOAE threshold Ldpth and minimum L2)
– Result data table (including L2, f2, DPOAE level Ldp, noise floor level Lnf, and SNR)
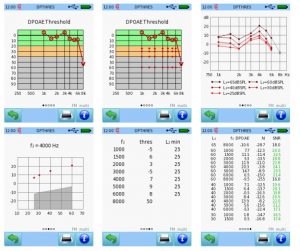
Figure 2: DPOAE Threshold result (top left/middle: DPOAE thresholds; top right: DPOAE gram; bottom left: DPOAE I/O function; bottom middle: threshold table; bottom right: data table)